
Analysis On Vanadium Products And Fenb Imports Statistics In 2019-2020
www.ferroalloynet.com: Since March 2019, the price of vanadium in Europe has been higher than the domestic price, and it has been almost 20 months today. In 2019, with the widening price difference between China and foreign countries, domestic traders began to import vanadium products in July 2019. The import volume in August increased significantly compared with the previous period. From September to December 2019, the import volume of vanadium pentoxide and ferrovanadium increased month by month, but the monthly conversion of vanadium pentoxide did not exceed 500 tons. The following table summarizes the import and export data of ferroniobium and vanadium in 2019:
| Imports in 2019 | V2O5(ton) | FeV50(ton) | FeV80(ton) | FeNb |
| Jan | 20.217 | 20 | 0.125 | 7010.284 |
| Feb | 0.212 | 0 | 0.8 | 2999.721 |
| Mar | 0.202 | 0 | 0 | 3200.427 |
| Apr | 0.003 | 0 | 0.5 | 4861.786 |
| May | 0.346 | 0 | 1 | 4546.789 |
| Jun | 0 | 72 | 1.5 | 3931 |
| Jul | 7.599 | 74.032 | 21.5 | 2937.352 |
| Aug | 80.003 | 0 | 41 | 2550.408 |
| Sep | 220.005 | 156 | 34.817 | 2385.18 |
| Oct | 299.001 | 52 | 46 | 3395 |
| Nov | 400.443 | 133.376 | 110.5 | 5953.5 |
| Dec | 431.942 | 254.204 | 22.5 | 2915.443 |
| Total | 1459.973 | 761.612 | 280.242 | 46686.89 |
In 2020, the outbreak of COVID-19 swept the world. At the beginning of the year, the domestic vanadium market was blocked by traffic control and logistics, and the terminal demand was adjusted. As a result, the price of vanadium products was affected to a certain extent. However, due to the epidemic situation not being well controlled in Europe and the United States, terminal demand has been sharply reduced, production adjustment is not big, supply is relatively stable, the relationship between supply and demand is unbalanced, and supply exceeds demand. There are few inquiries in European and American markets. The price difference between European and domestic vanadium pentoxide is widening. The average monthly import volume of vanadium pentoxide has increased from 400-500 tons at the beginning of the year to 1675 tons in August this year, which was the highest monthly import volume of this year.
| Imports in 2020 | V2O5(ton) | FeV50(ton) | FeV80(ton) | FeNb |
| Jan-Feb | 700.721 | 120 | 89 | 4435 |
| Mar | 480.003 | 20 | 81 | 1820 |
| Apr | 120.005 | 20 | 42.51 | 1970.18 |
| May | 60 | 20 | 81 | 3274.015 |
| Jun | 779.003 | 210 | 81 | 5343 |
| Jul | 676.001 | 379.446 | 156.5 | 2067.176 |
| Aug | 1675 | 440 | 114 | 1647.884 |
| Sep | 1320.003 | 318.5 | 81.5 | 2849.998 |
| Oct | 1000.101 | 565.005 | 59 | 2742.747 |
| Nov | ||||
| Dec | ||||
| Total |
The chart below shows the trend of average price of vanadium pentoxide in Europe from January to November 2020. In the first half of the year, the price of vanadium in Europe rose and fell from time to time, and then decreased to 5.1-5.6 USD/lbV2O5 in the middle of the year, the price difference was nearly 30000 yuan / ton compared with that of domestic V2O5 flake at that time. Due to the large price difference, domestic vanadium enterprises are looking at the right time and importing actively.
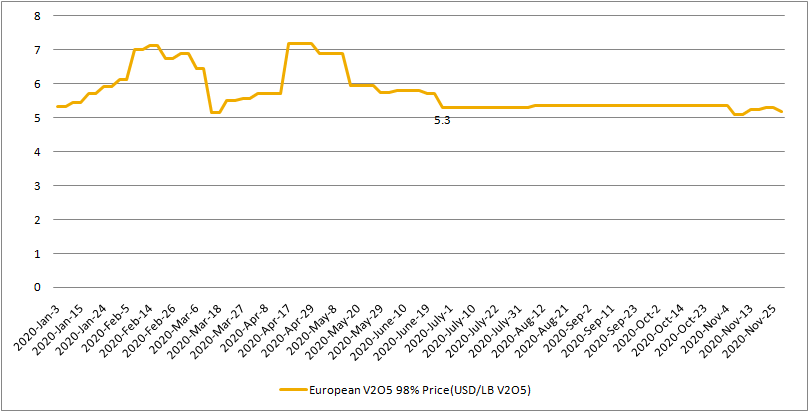
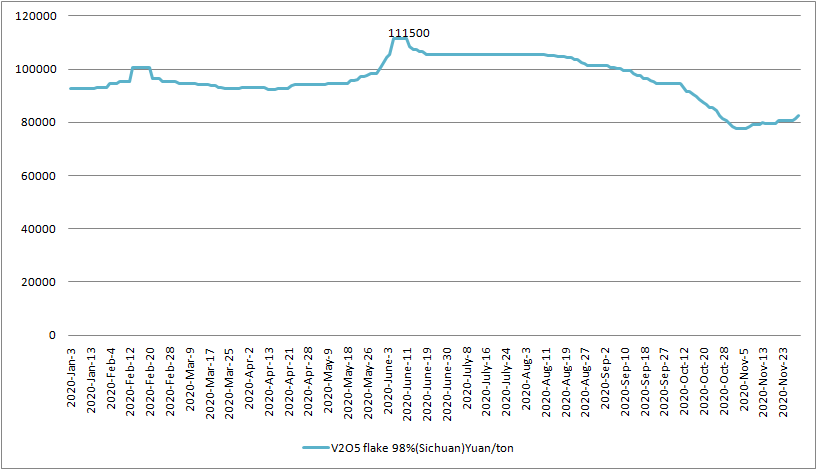
According to the customs statistics, the average monthly import volume of vanadium pentoxide from June to October was about 1090 tons. The large increase of imported vanadium products also brought certain pressure to the domestic market. Domestic production increased without decrease plus the imported resources, the pressure of oversupply increased, then the domestic vanadium price continued to decline.
www.ferroalloynet.com